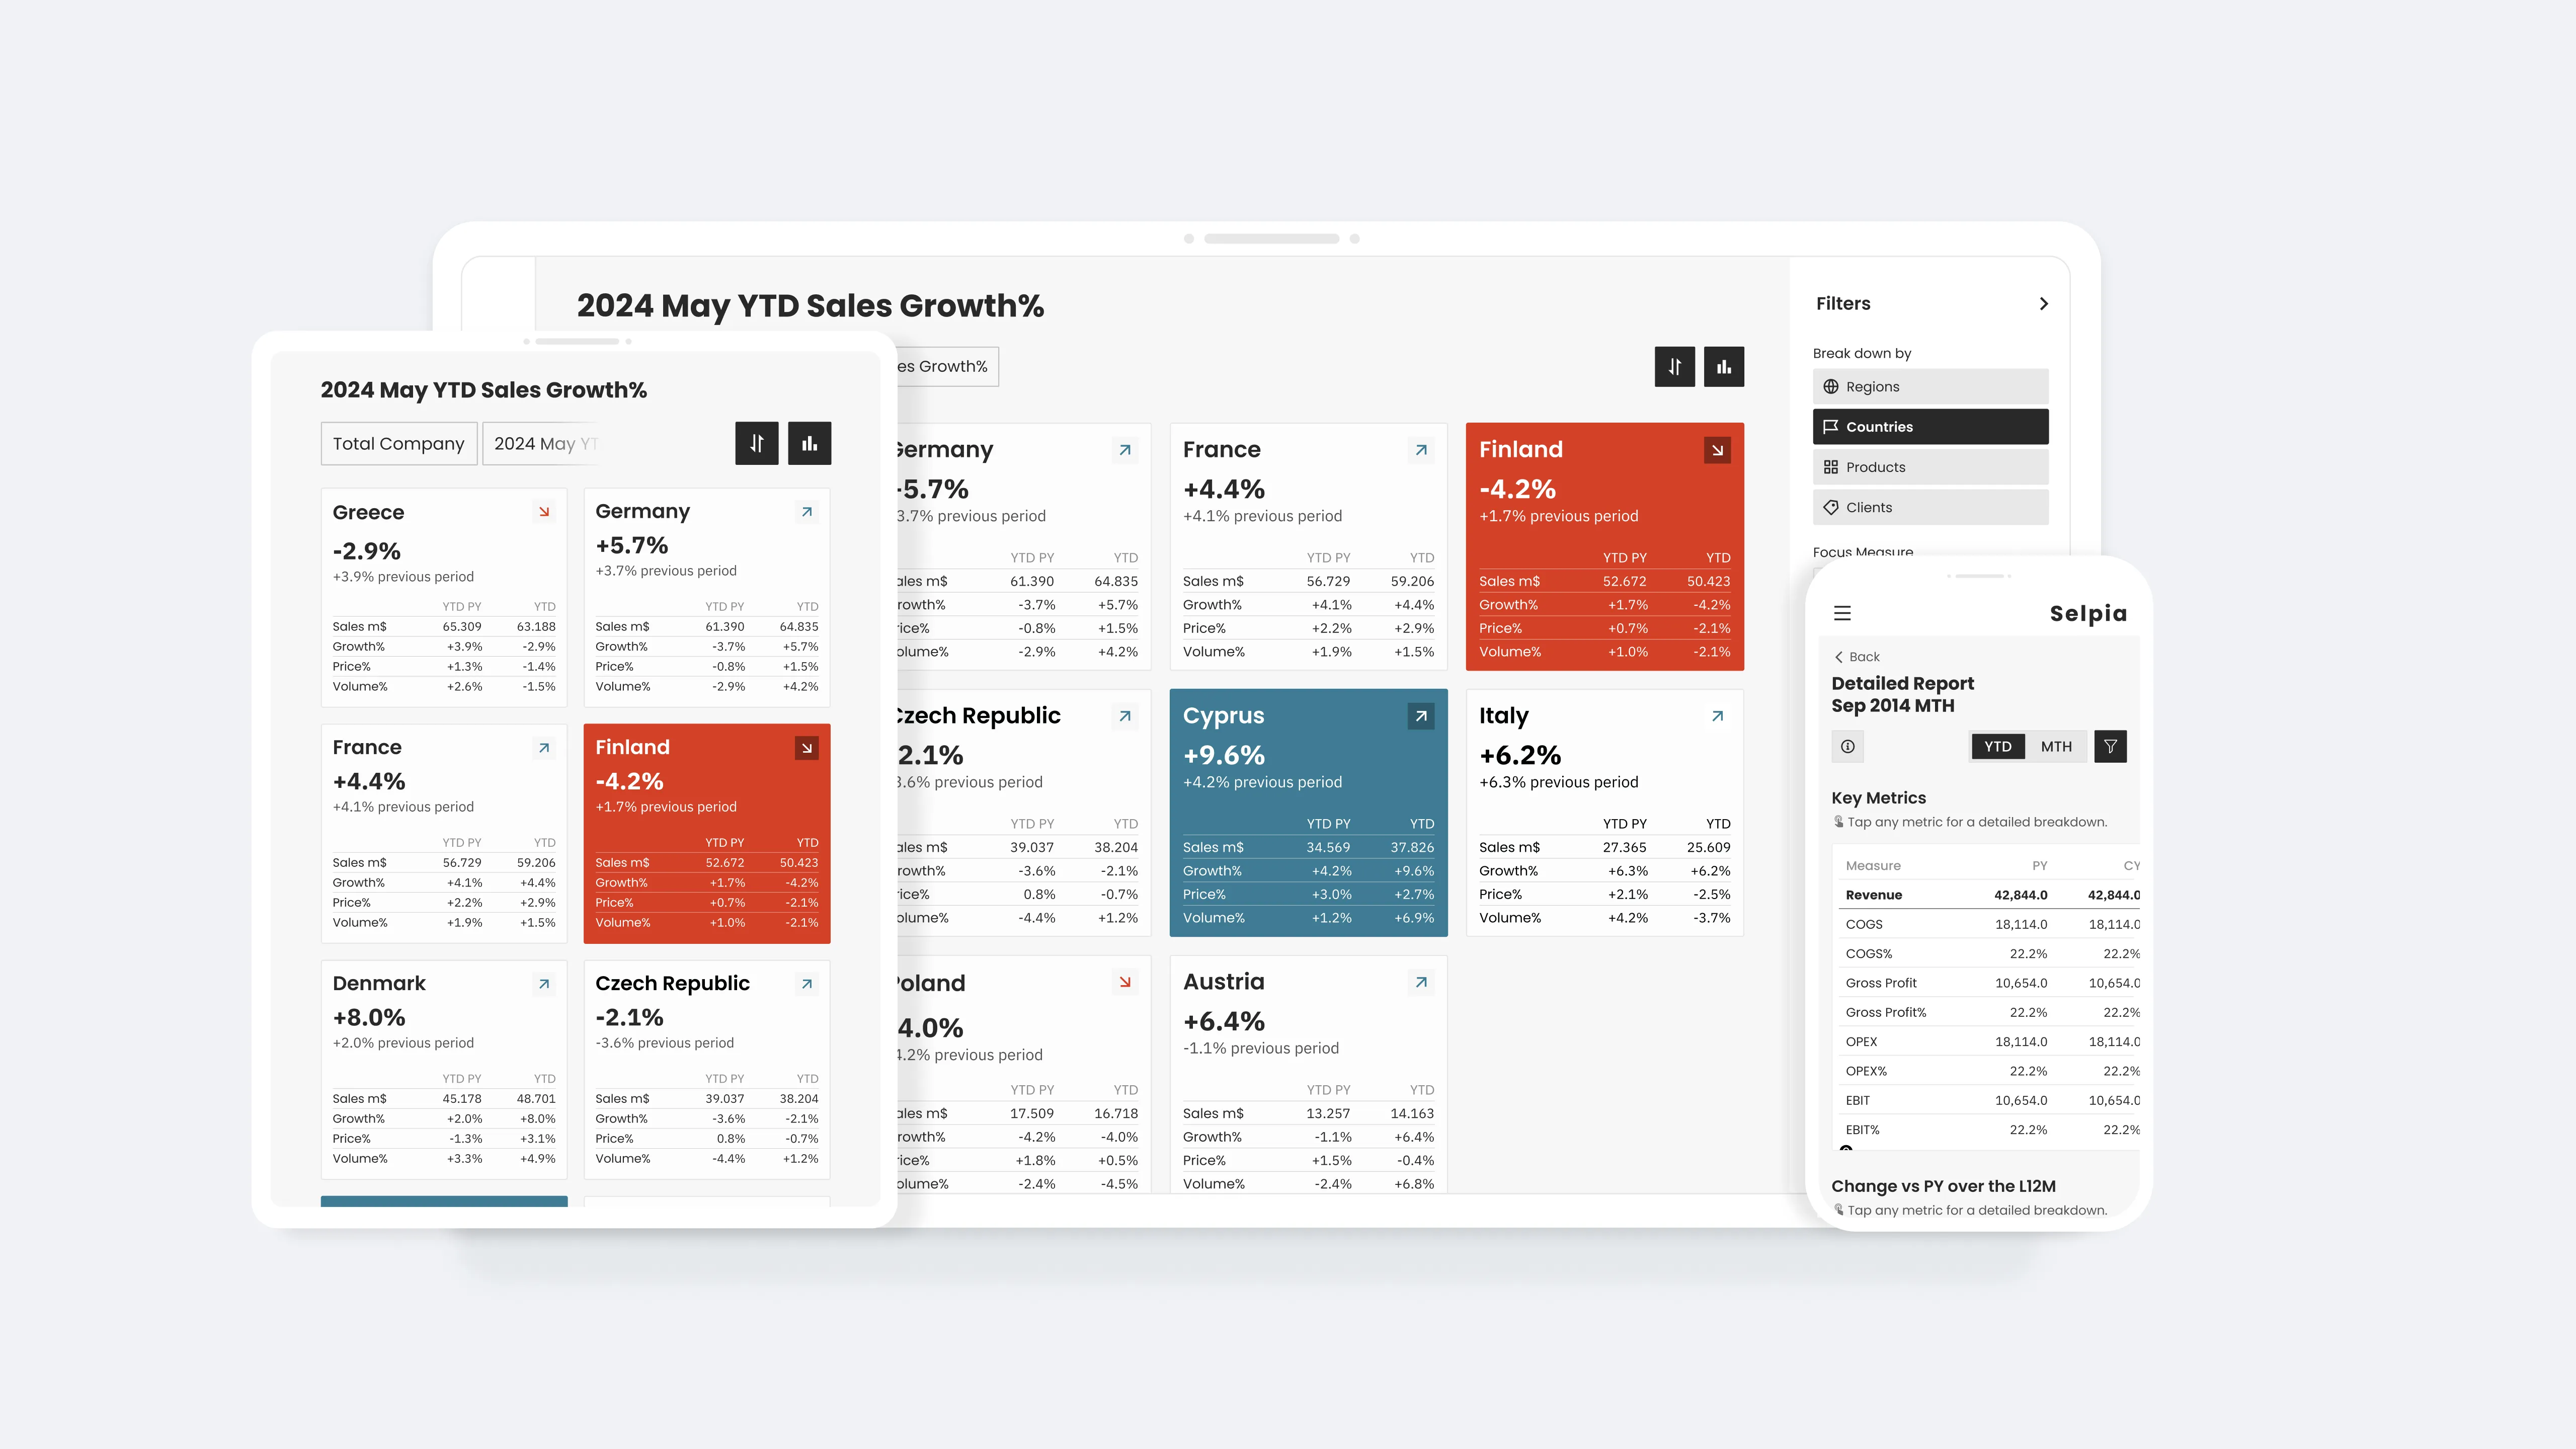
Organizations can significantly increase the success rate of their Business Intelligence (BI) and Data & Analytics solutions by incorporating appropriate Experience Design services early in the implementation process.
Key Insights
- Many Data & Analytics solutions struggle to achieve proper user adoption, while User experience remains one of the most underestimated factors in successful BI/Data & Analytics implementations;
- Early integration of appropriate Design services can substantially improve impact and adoption rates;
- Organizing these services through DesignOps helps structure and scale the design effort;
- Design support must be tailored specifically for the data and analytics environment, incorporating: data viz best practice, design considerations for off-the-shelf solutions (e.g., PowerBI), fundamental understanding of business domains and metrics;
Context
Data & Analytics departments typically manage numerous projects implementing solutions across various technologies. Delivery teams primarily focus on: data source integration,
data engineering and developing reports and dashboards to address business questions. However, many of these solutions face adoption challenges.
Based on my experience, two main factors frequently contribute to this:
- Requirements Gap: A disconnect often exists between user requirements before and after solution development. While many rely on detailed Business Requirements Documents as a safeguard, this proves insufficient.
- Poor User Experience: Both performance issues and complex, inconsistent user interfaces impact adoption. Teams often mistakenly assume that BI developers or built-in features will automatically ensure a positive user experience.
Design meets Data & Analytics
Thankfully, more and more departments delivering Data & Analytics solutions (e.g., D&A, IT, and BI teams) recognize that User Experience plays a crucial role in the successful adoption of their tools. Design has much to offer (beyond aesthetics) to the world of analytics but must be implemented and considered carefully in this unique environment.
Here is my subjective selection of three favorite design services and techniques worth considering for analytical teams, along with my perspective on making them relevant in the context of a data & analytics environment:
| wireframes & mockups | interactive prototypes | design workshops (& elements of research) |
|---|
| Purpose | Early visual validation helping stakeholders understand and shape the final product | Clickable simulations providing deeper understanding of complex solutions | Early requirements validation and stakeholder alignment |
| Benefit | Improved delivery team planning, UI standardization, development time savings | Validates user interactions and specific use cases across different form factors | Enhanced user-centric approach, comprehensive functional and non-functional requirements |
| Analytics considerations | Must include real metadata with sample data, account for platform limitations (e.g., PowerBI), and adhere to data visualization best practices | Rapid delivery, targeting: <20% of PoC development time | Domain-specific insights and user needs |
I believe that there are at least 4 key elements of relevant design support for analytics solutions.
- Designers with the right skills and mindset: Look for folks that already know or are keen to learn more about business domain, data visualization best practices, and specific guidelines or limitations while designing for out-of-the-box BI platforms/solutions (e.g., PowerBI). For me, designers need to know that you must not present growth on a donut chart (in most cases, this type of chart shouldn’t be even suggested) and be keen to include real metadata and values that are random but within reasonable range and respecting metric formatting;
- Doing it as early as possible: Design support makes the biggest impact before the delivery team kicks in. There are many tools and techniques used by designers that can help better understand users’ needs, discover, and explore more. When doing it early, you can properly validate requirements by turning them into something more visual than BRD, like mockups or even more interactive prototypes. Quite often, we have noticed that many stakeholders get more involved and aligned when requirements are presented to them in a more visual - easier and faster to digest form;
- Doing it quickly: Work with common tools ecosystem, have ready visual language aligned with client’s branding guidelines, library of ready-to-use templates and components, so you can deliver visual artifacts I have mentioned above within hours, not days (definitely not weeks). The value is in quick validation through visuals before delivery starts;
- Organizing around DesignOps concept: If you want to make an impact on scale for larger organization, then consider leveraging the DesignOps framework;
DesignOps framework
The challenge of course is to make it work at scale in a repeatable model. Even with smaller design support, it’s worth consciously orchestrating all designers, processes and craft of designers to amplify their value and impact at scale - which is the Nielsen Norman Group’s (NN/g) definition for DesignOps. I recommend adopting their framework, focusing on how designers will get work done, collaborate with delivery teams and internal clients as well as how you plan to make an impact. I recommend focusing on:
| How we get work Done | How we collaborate | How we make Impact |
|---|
| Design System for Analytics (per platform) | Fitting into the Delivery process | Guidelines and assets management |
| Common Tools ecosystem | Iterating and version control | Training and onboarding others |
| Workflow guidelines per project type | Review and Sign-off process | Quality Assurance |
| Clear handoff procedure | Measuring Impact |
Reach out to us at hello@studio2wx.com if you are interested in specifics on how we implement each of these areas in practice for our clients.
Benefits & Impact
- Lower development and overall delivery cost: Early design involvement helps identify and resolve issues before they become expensive development challenges (especially for the custom development);
- Consistent experience and corporate standardization: A unified design system ensures all analytics solutions follow the same patterns and guidelines across the organization;
- Better adoption and usage: When users encounter intuitive, well-designed interfaces, they’re more likely to embrace and regularly use the tools;
- Reduced training cost: Intuitive design and consistent interfaces minimize the need for extensive user training and support;
- Stakeholder alignment: Visual artifacts and prototypes help ensure all stakeholders share the same vision and expectations for the final product;
- Trust and credibility: Well-designed solutions that work as expected build confidence in the data & analytics team’s capabilities;
- Better user experience: Thoughtful design ensures solutions are not just functional, but also enjoyable and efficient to use.
- Better accessibility: Design consideration ensures analytics solutions are more usable by all team members, regardless of their abilities;
- Better and more insightful data visualization, innovation and creativity: Design thinking brings fresh perspectives to solving analytics challenges and presenting data and information (where it make sense to explore);


